Integrations
Prometheus
This document shows you how you can integrate Callgoose SQIBS with Prometheus. Incidents will be creating in Callgoose SQIBS when there is a incident created in Prometheus as per the Alert rule configured by you in the Prometheus
This documentation is created to test the Integration between different vendors. Different application monitors and different environments may require different values to get a meaningful incident and incident description.
In Callgoose SQIBS
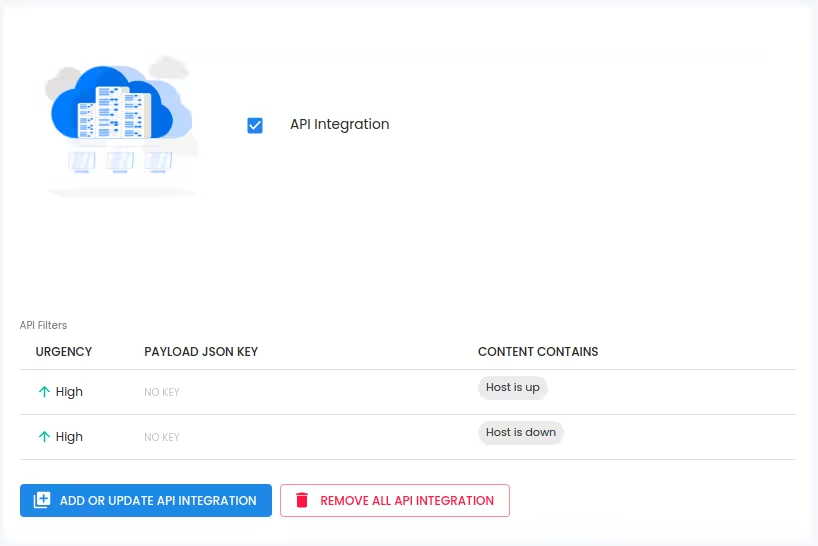
Create filter as per the Prometheus workflows.
- For test purpose, create an API filter like this
In Prometheus
- Create a Callgoose SQIBS webhook endpoint in Prometheus Ensure you have installed Prometheus Alertmanager before that. Log into the Prometheus monitoring system and edit the alertmanager configuration file alertmanager.yml and add the receiver to callgoose-sqibs
# A default receiver
   receiver: 'callgoose-sqibs'
receivers:
   - name: 'callgoose-sqibs'
     webhook_configs:
       - url: 'https://xxxxxxxx.callgoose.com/sqibs-api/v1/process?from=theus&token=xxxxxxxxxxxxxxxxxxxxxxx'
       send_resolved: true
- You can use this receiver: 'callgoose-sqibs' in any of your alert routes.
- Below is the sample
-> alertmanager.yml file
route:
   group_by: ['alertname']
   group_wait: 10s
   group_interval: 30s
   repeat_interval: 10m
# A default receiver
   receiver: 'callgoose-sqibs'
receivers:
   - name: 'callgoose-sqibs'
     webhook_configs:
       - url: 'https://xxxxxxxx.callgoose.com/sqibs-api/v1/process?from=theus&token=xxxxxxxxxxxxxxxxxxxxxxx'
       send_resolved: true
inhibit_rules:
   - source_match:
   severity: 'critical'
   target_match:
   severity: 'warning'
   equal: ['alertname', 'dev', 'instance']
- All the values must be in Json format. Since these values are already in Json key format, No action required from your end to change it to Json format
- Please make sure to set “send_resolved: true” in the alertmanager.yml to get resolved notification from Prometheus as per your requirements.
- How to get endpoint URL
- Refer this link for How to send to Sqibs API
- Please make sure you have added API filter contains values in Callgoose SQIBS before you send test notifications to create the incident in Callgoose SQIBS. You may also add API filter after checking API Log
Sample rule file node_exporter_rules.yml in the prometheus
Below is the sample
-> alertmanager.yml file
groups:
   - name: alert_rules
     rules:
       - alert: HostDown
         expr: up == 0
         for: 1m
         labels:
           severity: critical
         annotations:
           summary: "Host is down - [{{ $labels.instance }}]"
           description: "Host is down for more than 1 minute - [ {{ $labels.instance }}] - [{{ $labels.job }}] "
       - alert: DiskSpaceFree10Percent
         expr: node_filesystem_free_percent <= 10
         labels:
           severity: warning
         annotations:
           summary: "Host [{{ $labels.instance }}] has 10% or less Free disk space"
           description: "[{{ $labels.instance }}] has only {{ $value }} % or less free."
How to test
Shutdown the node_exporter host
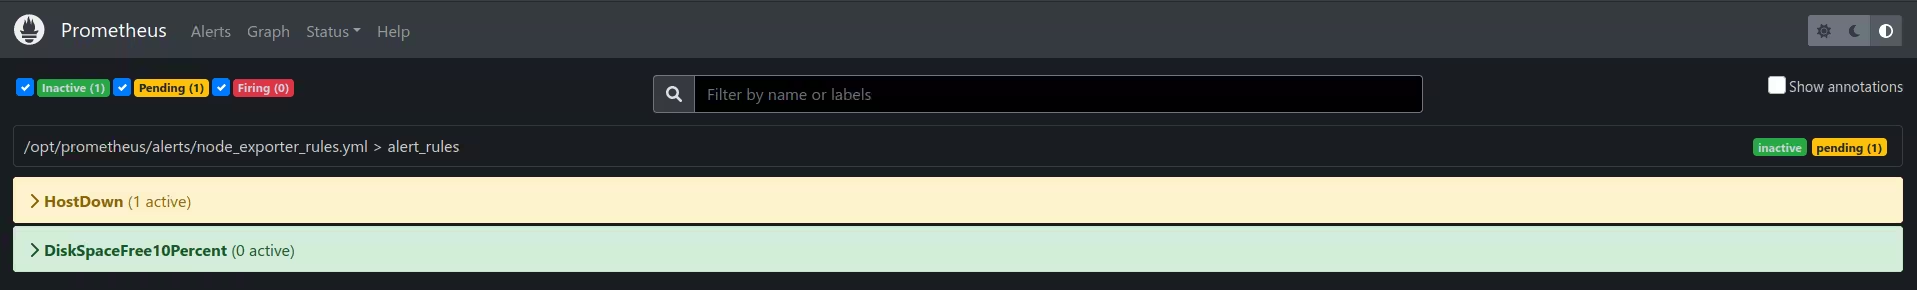
Check the Prometheus Web GUI
You can see that HostDown
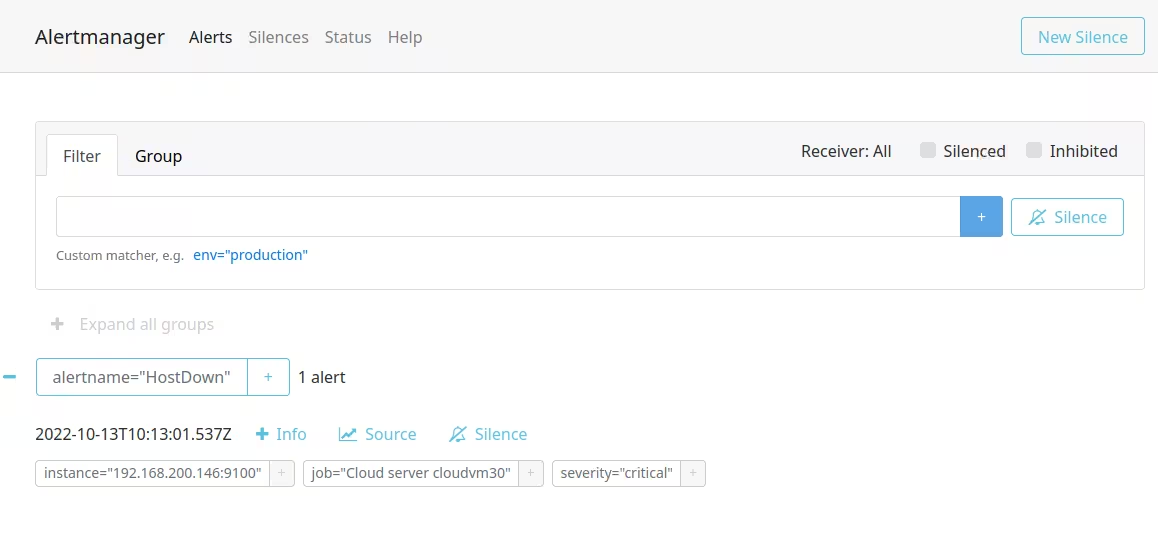
Check the Prometheus alertmanager Web GUIYou can see that Alert is created for HostDown
You can also see that this HostDown notification created an incident in Callgoose SQIBS.
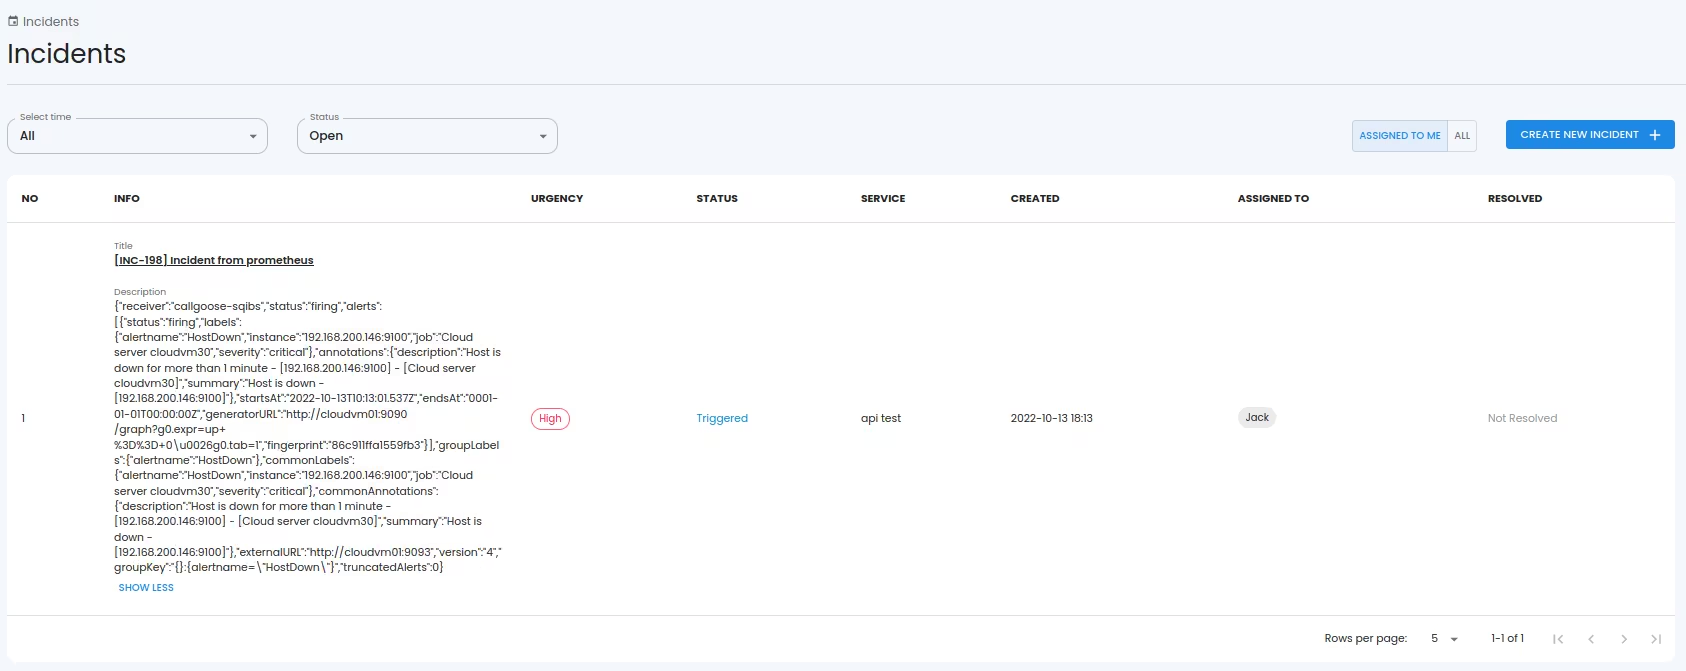
- When Prometheus payload 'status' value is 'firing,' it triggers an incident in SQIBS. Likewise, when the 'status' is 'resolved,' it automatically resolves the incident in SQIBS.